| Definitions | Data visualization | Methodology | Classifications and lists | Publications | Links | Contact |
Age — the age of the person concerned in full years (months, days) at the time of death.
Age-specific death rates (death rates by sex and age) — the number of deaths (specified by sex) in one age group during a year per 100,000 mean annual population in the same age group in the same year.
Amenable deaths to health care — a death is amenable if, in the light of medical knowledge and technology at the time of death, all or most deaths from that cause (subject to age limits if appropriate) could be avoided through good quality health care. See Plug et al article including Estonian data (reference below in publications list).
Autopsy rate — percentage of autopsies of all deaths in Estonia.
Birth weight — the first weight of an infant obtained after birth (preferably during the first hour of life).
Cause of death — the underlying cause of death, which has been defined by the World Health Organization as follows: a) all diseases, morbid conditions or injuries that either resulted in or contributed to death, or b) the circumstances of the accident or violence that produced any such injuries. Since 1997 the international classification ICD-10 is used.
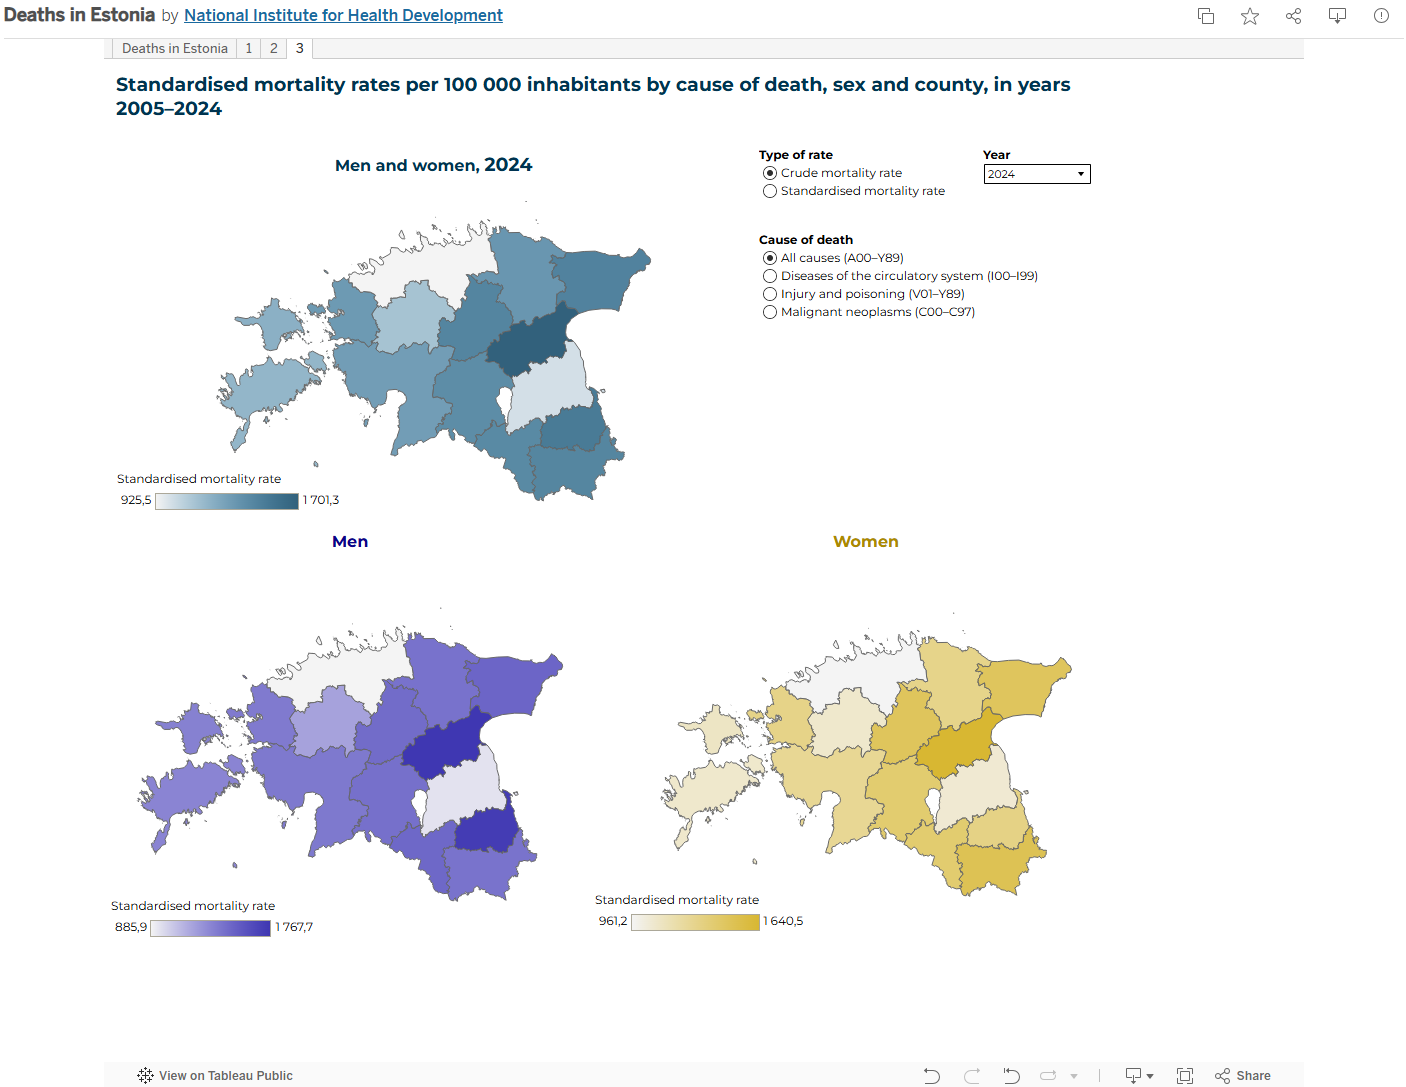
Crude mortality rate — annual number of deaths per 100,000 of mean annual population.
County/municipality — person's last residence. It is classified according to Administrative and Settlement Units of Estonia (EHAK) (see classifications and lists). Until 2017, data by the counties/municipalities is distributed by the administrative division that existed before administrative reform (October 2017). Data starting from 2018 is distributed by new administrative division.
Early neonatal deaths — the deaths of infants who died during the first week of their life (aged 0–6 days).
Early neonatal mortality rate — annual number of early neonatal deaths per 1000 live-births in the same year.
Gestational age — duration of pregnancy in full weeks (or days), measured starting from the first day of last normal menstrual period or using ultrasound.
ICD-10 — International Statistical Classification of Diseases and Related Health Problems, tenth edition (see classifications and lists).
Infant deaths — the deaths of up to one-year-old live-born children.
Infant mortality rate — infant (under one-year-old children) deaths per 1000 live births in the same year.
Late foetal deaths — see stillbirth.
Late neonatal deaths — the deaths of infants who died after the first week but before 28 completed days of their life.
Live birth — birth of a child with any sign of life (breathing, heartbeat, pulsation of the umbilical cord and/or apparent movements of voluntary muscles) regardless of the length of gestation.
Mean annual population — half the sum number of the population at the beginning and at the end of the year.
Neonatal deaths — the deaths of infants during the first four weeks of their life.
Perinatal mortality rate — annual number of perinatal deaths per 1000 births in the same year.
Perinatal deaths — all foetuses and infants who died within the perinatal period (commences at 22 completed weeks and ends 0–6 days after birth).
Perinatal period — interval starting after 22 full weeks of pregnancy (154 days) until seven days of age after birth.
Place of residence — usual place of residence reported by doctor issued medical death certificate, if not reported then according to the Population Register.
Preventable deaths — a death is preventable if, in the light of understanding of the determinants of health at the time of death, all or most deaths from that cause (subject to age limits if appropriate) could be avoided by public health interventions in the broadest sense.
Standardised mortality rate — shows how high the mortality rate would be if the age distribution of Estonian population were the same as that of population standard. New European Standard Population (published in 2013) is used.
Table 1. Age distribution of European Standard Population, 2013
Total 100 000 0 1000 1–4 4000 5–9 5500 10–14 5500 15–19 5500 20–24 6000 25–29 6000 30–34 6500 35–39 7000 40–44 7000 45–49 7000 50–54 7000 55–59 6500 60–64 6000 65–69 5500 70–74 5000 75–79 4000 80–84 2500 85–89 1500 90–94 800 95–99 175 100+ 25
Stillbirth — the intra-uterine death of a foetus weighing at least 500 grams at birth or which took place after the 22nd week of pregnancy. This definition differs from that recommended by WHO as it includes late foetal death with birth weight <500 grams. All combinations of birth weight and gestational age are published in the table on perinatal mortality.
Mortality statistics cover both registered events of Estonian residents as well as the vital events of Estonian residents registered in the representations of Estonia. The data do not include events which were registered in Estonia or in the representations of Estonia, if place of residence of the deceased was abroad. Until 1993 statistics on deaths were based on death records of all deaths registered at the Register offices of counties and local governments, and starting from 1994 – on statistical forms filled by doctor which in 1996 was named medical death certificates.
In 2008 Estonian Causes of Death Register was established at the National Institute for Health Development, data collection and part of archive were transferred there from Statistics Estonia. Since then medical death certificate consists of four pages of which first containing medical information is sent directly to Causes of Death Register, the last page with socio-demographic data is used for administrative registration. Second and third pages are received by relatives of the deceased and health care institution respectively. The processing of the data on deaths is based on the date of the death. The deaths of Estonian citizens whose place of residence is abroad and whose death is registered abroad are excluded. Also, deaths of foreign citizens who died in Estonia but whose place of residence is outside Estonia are excluded. Place of residence is defined as reported by certifier (de facto). In this respect data may differ from those published by Statistics Estonia as their place of residence was defined according to Population Register (de jure) in period 2008–2015. Since 2016 Statistics Estonia is using residency index (data is gathered from many registers) and NIHD is publishing data according to last residence known by physician. More info about Statistics Estonia' residency index can be found in E.-M. Tiit and E. Maasing methodology article "Residency index and its applications in censuses and population statistics" (PDF-format) published in Quarterly Bulletin of Statistics Estonia 3/2016 (pages 53–60).
The source of data on autopsies until 2014 was annual health statistic report „Hospital“, which was filled by all inpatient health care service providers. The source from 2015 is Estonian Causes of Death Register, which includes data on autopsies performed by Estonian Forensic Science Institute. The number of autopsies from 2015 includes all autopsies performed in Estonia for people died in the respective calendar year. Until 2014 the data contained autopsies performed by hospitals during the calendar year. Autopsy rate by cause of death and sex is published in Statistics Estonia database – PO612: Autopsy rate by sex and cause of death.
In 2014, sequelae of external causes of morbidity and mortality were added to standard table “SD21: Deaths by cause, sex and age group“ to implement a new shortlist developed by Eurostat. Numbers of such cases recorded since 1997 is brought in table below:
Table 2.| Y85 | Y85.0 | Y86 | Y87 | Total | |
|---|---|---|---|---|---|
| 1997 | 2 | 1 | 3 | ||
| 1998 | 3 | 1 | 4 | ||
| 1999 | 1 | 4 | 5 | ||
| 2000 | 2 | 2 | 4 | ||
| 2001 | 7 | 7 | |||
| 2002 | 2 | 1 | 3 | ||
| 2003 | 1 | 4 | 5 | ||
| 2004 | 1 | 4 | 5 | ||
| 2005 | 1 | 1 | 2 | ||
| 2006 | 2 | 2 | |||
| 2007 | 1 | 5 | 6 | ||
| 2008 | 3 | 3 | |||
| 2009 | 1 | 4 | 5 | ||
| 2010 | 3 | 3 | |||
| 2011 | |||||
| 2012 | 2 | 2 | |||
| 2013 | 3 | 1 | 4 | ||
| 2014 | 1 | 1 | |||
| 2015 | 1 | 1 | |||
| 2016 | 1 | 1 | |||
| 2017 | 1 | 1 | |||
| Total | 12 | 3 | 50 | 2 | 67 |
The source of methodology to define quality indicators was “European Statistics on Causes of Death – COD” a document issued by Eurostat on 31st May 2007 to provide the Member States with guidelines to implement recommendations of the ad-hoc Task Force on Quality Control. With regard to some of these indicators the situation in Estonia did not change in 1989–2010. Mortality data refer to residence concept; data on foreign residents died in Estonia are collected, but not published or sent to international organizations and not used to calculate quality indicators. In case of autopsy medical death certificate is filled by forensic or hospital pathologist performed it, so 100% of autopsy results are used for certification and coding. Medical doctors are trained in certification before graduation as a part of obligatory training in pathological anatomy and forensic medicine. After graduation guidelines and occasional training courses in certification are provided by mortality data collection unit, frequently in co-operation with the Ministry of Social Affairs. Only medical doctors have been allowed to fill in medical death certificate since 1994, before a small number of deaths were certified by assistant physician (feldsher).
Eight of recommended quality indicators are presented in table 3. The most visible impact on data quality was attributed to recruitment of new (second) mortality coder in 2003, resulted in sharp decrease of certificates with one coded line (60.8–17.9%). Steadily growing share of persons died in hospital as well as decreasing share of cases certified by pathologists reflects changes in Estonian health care system. Introduction of automated coding software as quality control tool (ACME in 2005 and IRIS in 2010) did not have significant impact on these indicators. The most relevant indicator to evaluate impact of automated coding systems would be apparently percentage of changed underlying cause codes, whereas indicators proposed by TF on Quality Control are to assess quality of certification.
This analysis was performed under grant agreement with European Commission “Quality Improvement of Causes of Death Statistics by Automated Coding” no. 10501.2009.002-2009.461 in 2011.
Table 3. Quality indicators, per cent of cases
| Year | | Died in hospital | Just one line filled in (electronic database) | R00–R99 Symptoms, signs etc | R54 Senility | R98–R99 Unknown cause of death | X59 (unspecified factor) of all deaths | X59 (unspecified factor) of external causes | Physician | Forensic | Pathologist | Other |
| 1989 | 63,6 | 12,6 | 20,8 | 2,9 | 37,3 | n/a | 0,5 | 0,3 | n/a | n/a | n/a |
| 1990 | 65,1 | 14,1 | 18 | 2,8 | 35,6 | n/a | 2,2 | 1,8 | n/a | n/a | n/a |
| 1991 | 69,8 | 14,1 | 13,5 | 2,6 | 36,7 | n/a | 3,3 | 2,9 | n/a | n/a | n/a |
| 1992 | 64,4 | 15,1 | 14,8 | 2,5 | 37,6 | n/a | 4 | 3,6 | n/a | n/a | n/a |
| 1993 | 64 | 17,1 | 15 | 2,5 | 38 | n/a | 4,5 | 4 | n/a | n/a | n/a |
| 1994 | 64,9 | 20,6 | 14,4 | n/a | 35,6 | n/a | 3,8 | 3 | n/a | n/a | n/a |
| 1995 | 65,4 | 18,6 | 15,9 | n/a | 36,7 | n/a | 4,4 | 3,3 | n/a | n/a | n/a |
| 1996 | 67,2 | 17,4 | 15,4 | n/a | 36,8 | n/a | 4,7 | 3,7 | n/a | n/a | n/a |
| 1997 | 67 | 17,7 | 15,4 | n/a | 38,2 | n/a | 4,5 | 3,5 | 0,9 | 0,1 | 1,1 |
| 1998 | 66,4 | 18,4 | 15,2 | n/a | 39,3 | n/a | 4,3 | 3,2 | 1 | 0,1 | 1,1 |
| 1999 | 65,5 | 19 | 15,5 | n/a | 40,1 | n/a | 4,5 | 3,3 | 1,1 | 0,1 | 1 |
| 2000 | 66,8 | 18 | 15,3 | n/a | 41,2 | n/a | 4,5 | 3,3 | 1,2 | 0,2 | 1,4 |
| 2001 | 66,8 | 19,4 | 13,8 | n/a | 41,6 | 60,3 | 3,9 | 2,8 | 1,1 | 0,4 | 3,3 |
| 2002 | 68,7 | 18,6 | 12,7 | n/a | 43,8 | 60,8 | 4,2 | 2,8 | 1,4 | 0,2 | 2 |
| 2003 | 69,2 | 17,5 | 13,3 | n/a | 45,5 | 17,9 | 4 | 2,7 | 1,2 | 0,2 | 2 |
| 2004 | 70,7 | 16,4 | 12,9 | n/a | 47,8 | 16,6 | 3,5 | 2,4 | 1 | 0,2 | 2 |
| 2005 | 72,5 | 15,7 | 11,8 | n/a | 48,7 | 17,6 | 3,6 | 2,6 | 1 | 0,2 | 1,8 |
| 2006 | 74 | 14 | 11,9 | n/a | 48,9 | 17,6 | 3,6 | 2,6 | 0,9 | 0,2 | 1,7 |
| 2007 | 73 | 15,3 | 11,7 | n/a | 50,9 | 18,3 | 3,9 | 2,6 | 1,2 | 0,1 | 1,6 |
| 2008 | 75,8 | 13,2 | 11 | n/a | 52,8 | 15,2 | 2 | 1,2 | 0,7 | 0,1 | 1,3 |
| 2009 | 77,8 | 11,2 | 11 | n/a | 53,9 | 15,2 | 1,8 | 1 | 0,8 | 0,1 | 0,9 |
| 2010 | 79,2 | 10,7 | 10,1 | n/a | 54,7 | 15,9 | 2 | 1 | 1 | 0,1 | 1,5 |
Causes of death are coded according to International Statistical Classification of Diseases and Related Health Problems ICD-10 (tenth revision). For publication purposes some entries are truncated, e.g. Certain infectious and parasitic diseases -> Infectious and parasitic diseases, Tuberculosis and Sequelae of tuberculosis -> Tuberculosis. Respective ICD-10 codes are indicated in brackets.
Classification of Administrative and Settlement Units of Estonia (EHAK)
This classification is used upon submission of regional statistics. Regional statistics are submitted by 15 counties. Information about Tallinn and Tartu and also by other municipalities is submitted separately. Until 2017, data by the counties and municipalities is distributed by the administrative division that existed before administrative reform (October 2017). Data starting from 2018 is distributed by new administrative division. This classification system in Estonian is available on the webpage of the Statistics Estonia in the Classifications section.
Plug I, Hoffmann R, Artnik B, Bopp M, Borrell C. et al. Socioeconomic inequalities in mortality from conditions amenable to medical interventions: do they reflect inequalities in access or quality of health care? BMC Public Health 2012 12:346; 2012. https://doi.org/10.1186/1471-2458-12-346
Death statistics can be also found in the database of Statistics Estonia -> Population -> Vital events -> Deaths.
WHO methods and data sources for country-level causes of death 2000–2019
Gleb Denissov
Estonian Causes of Death Register
National Institute for Health Development
E-mail: Gleb.Denissov[at]tai.ee
Updated: 4.03.2026